Indoor vs Outdoor Air Pollution: Forest Hill
This data story describes differences in indoor and outdoor pollution levels between two monitors at a location in Forest Hill. The story looks at the period from 23 June to 31 October 2020 when both monitors were online.
Based on citizen data collected in collaboration with participants and residents in Forest Hill, London, we investigate particulate matter trends inside and outside the home. Overall, we find PM2.5 concentrations can be significantly lower indoors, but they generally follow similar patterns to outdoor air pollution.
I. Location
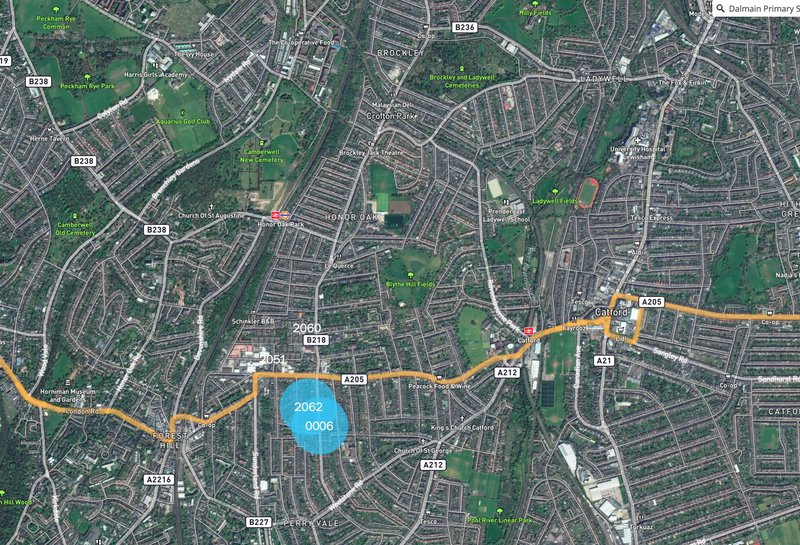
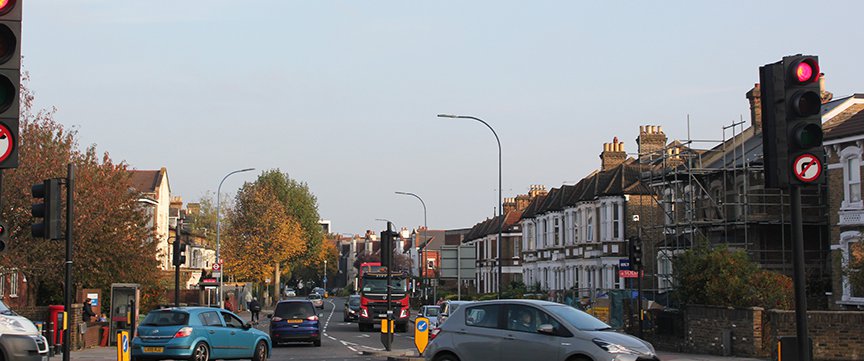
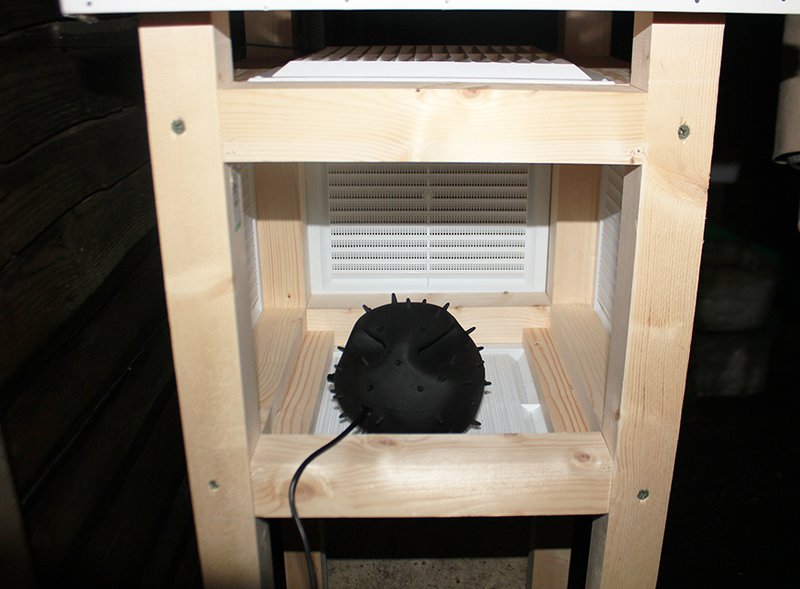
While testing the AirKit toolkit in Forest Hill in South East London, some participants became interested in studying the relationship between particulate matter concentrations outside and inside their homes. Living close to the South Circular, one of South London’s busiest roads, they were concerned how traffic could impact air quality in their home. Dustbox 2062 is outdoors, and Dustbox 0006 is indoors in a residential location. The Dustbox 2.0 (or second-generation Dustbox) measures particulate matter 2.5 (PM2.5), a pollutant that is especially hazardous to human health.
II. Is There Evidence of a Problem
This data story analyzes data from 23 June to 31 October 2020. Figure 1 shows that during this time, overall particulate matter concentrations both indoors and outdoors remained below the World Health Organisation (WHO) 24-hour mean guideline for PM2.5 of 25 µg/m3 (although there is no safe level of exposure, and this guideline is for outdoor rather than indoor air quality). The highest daily average outdoors was on 12 August 2020 at almost 11 µg/m3. Indoors, the highest 24-hour average was just over 1 µg/m3 on 19 October 2020. (Although, when reviewing hourly data higher levels were evident up to 6 to 7 µg/m3, most likely due to cooking and cleaning activities.)
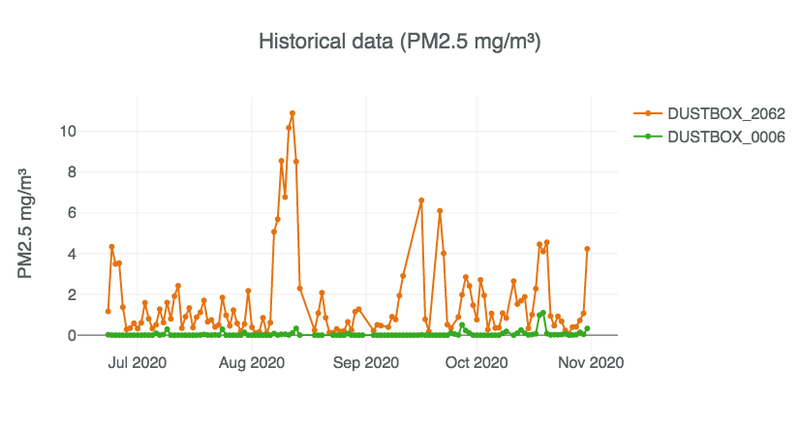
Figure 1: Line graphs of 24-hourly mean concentrations of PM2.5 for Dustboxes 0006 (indoors) and 2062 (outdoors), 23 June to 31 October 2020 (units: µg/m3).
Figure 2 includes data through to 14 November to show the effects of Bonfire Night both indoors and outdoors. This event is analyzed more closely in the Bonfire Night: Forest Hill Data Story. These dates have not been included in this indoor-outdoor comparison because they deviate from the general patterns observed during the main study period.
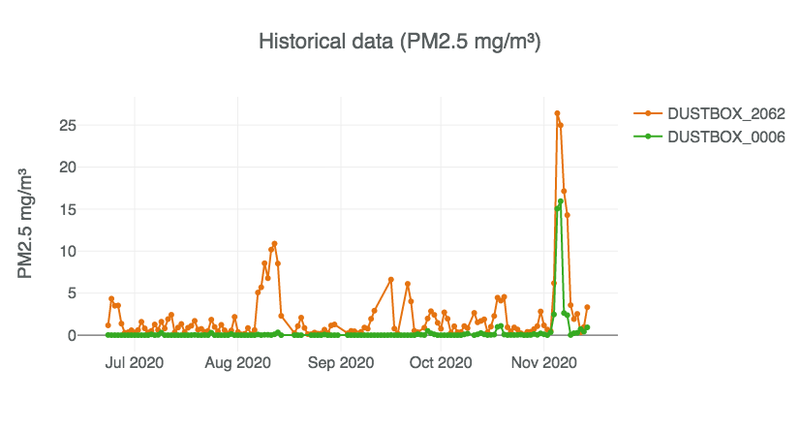
Figure 2: Line graphs of 24-hourly mean concentrations of PM2.5 for Dustboxes 0006 (indoors) and 2062 (outdoors), 23 June to 14 November 2020 (units: µg/m3).
Figure 1 also documents that PM2.5 concentrations indoors (0006) are significantly lower than outdoor levels (2062) at this location. Where there are peaks on 0006 they are generally small and follow the trend of 2062, suggesting outdoor pollution influences indoor air over daily cycles. The exception to these significantly lower indoor levels is in early November where Dustbox 0006 follows the trend of Dustbox 2062 more closely, reaching levels exceeding 15 µg/m3 on 5 and 6 November (as discussed in the Bonfire Night data story). Specific outdoor pollution events include:
- The outdoor Dustbox (2062) indicates slightly elevated levels of pollution between the 24 and 25 June. This was caused by regional sources from Holland, Belgium and northern France.
- Higher concentrations of particulate matter were evident during 7 August to 13 August, with levels reaching nearly 11 µg/m3 on the 12 August over a 24-hour period. London Air suggests that higher levels of particulates for this period were caused by hot weather and particulates travelling on light winds from the East. The indoor monitor for this period shows slightly elevated levels when compared to the previous week.
- There were short instances of interrupted data during mid-September, but there are slightly elevated particulate matter levels above 6 µg/m3 on 16 September and 21 September. London Air forecast moderate pollution on 16 September, but low pollution on the 21 September.
The location of the indoor monitor, set up in a living room, is significant in relation to these trends. The living room is at the front of the house, away from the kitchen but near a road that intersects with the South Circular road that experiences high volumes of traffic. If Dustbox 0006 were located in an area such as a kitchen in closer proximity to cooking, we would expect higher particulate matter levels and more pronounced deviations from trends outdoors. These patterns would especially be visible in minute- and hour-based data.
III. Characterising The Problem
In Figures 3 and 4, it can be observed that both the indoor and outdoor monitors follow similar trends. During the monitoring period, the highest mean concentrations occur on the weekends, especially on Fridays and Sundays.
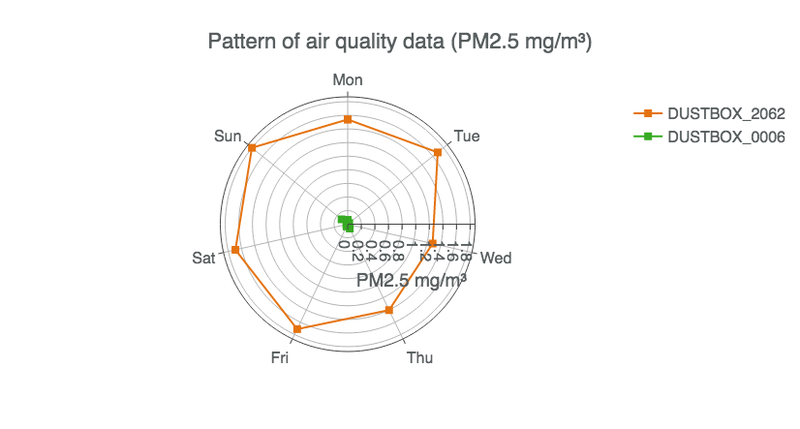
Figure 3: Pattern plot of 24-hourly mean concentrations of PM2.5 for Dustboxes 0006 (indoors) and 2062 (outdoors), 23 June to 31 October 2020 (units: µg/m3).
Levels tend to be elevated during the evening from 18.00 to 20.00. This could be related to increased traffic, cooking, and other activities that can take place during the early evening. These patterns also suggest that outdoor traffic-related emissions could be impacting particulate matter levels inside the home.
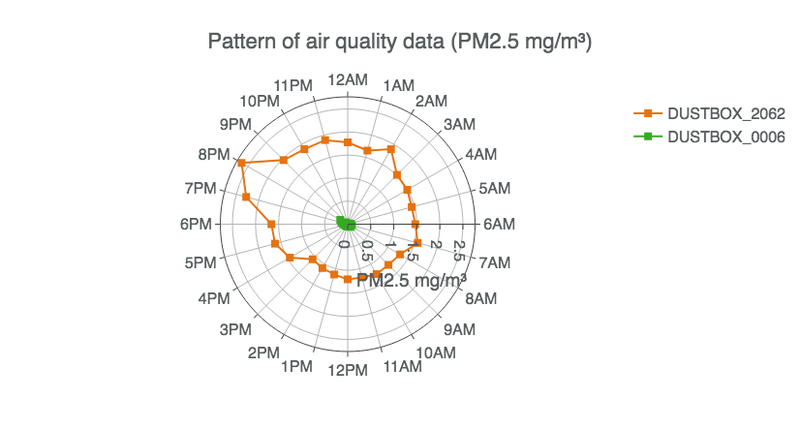
Figure 4: Pattern plot of hourly mean concentrations of PM2.5 for Dustboxes 0006 (indoors) and 2062 (outdoors), 23 June to 31 October 2020 (units: µg/m3).
IV. Drawing The Evidence Together
Using the tools provided through the Citizen Sense Airsift data analysis platform, we have analyzed the PM2.5 data for an indoor Dustbox (0006) and outdoor Dustbox (2062) at the same property. Our observations include:
- Throughout the monitoring period, pollution levels are generally below the WHO 24-hour mean threshold. However, patterns indicate elevated pollution levels that are evident during times of peak traffic activity.
- The indoor monitor tends to follow the pattern of the outdoor monitor but at much lower levels.
- The indoor monitor deviates from the trend of the outdoor monitors on Sunday afternoons. This is mostly likely caused by cooking activities. Overall, the location of the monitor in the living room results in lower readings than if it were in the kitchen.
- Hourly pollution patterns provide further detail on possible indoor pollution sources, as 24-hour averages provide less temporal granularity. By looking at data across different data resolutions it is possible to further pinpoint emissions sources.
V. Actions
In relation to the evidence and findings from this citizen-sensing study, we propose preliminary actions that consider the neighbourhood context and existing community organisations and initiatives. The key areas for addressing air pollution include actions that can be taken inside and outside the home, including local transport initiatives, green infrastructure, burning practices and additional monitoring. These actions have been developed in consultation with monitoring participants and local area residents.
Green infrastructure and the home
- Increase vegetation around properties including the density and height of hedging at roadways to act as a green screen.
- Improve ventilation and monitor outdoor pollution levels to close windows at times of elevated outdoor pollution.
- In areas of the home where particles are generated such as the kitchen, ensure adequate ventilation is in place.
Air quality monitoring
- Undertake further monitoring on the South Circular road to understand impacts of local traffic on PM2.5 levels in more detail.
- Increase indoor air quality monitor, especially coupled with outdoor monitors, to better understand patterns of PM2.5 levels caused by interior and exterior sources.
Transport infrastructure
- Introduce additional sustainable transport measures, including supporting the extension to existing cycle lanes as planned for the Deptford and Forest Hill areas.
- Prevent idling traffic near buildings so as to minimize outdoor air pollution impacting indoor air quality.
Acknowledgements
The Citizen Sense and AirKit projects are led by Professor Jennifer Gabrys. AirKit has been developed working in collaboration with postdoctoral researchers Dr Sachit Mahajan and Dr Joanne Armitage. Thanks are due to our additional collaborators including:
Common Knowledge contributed to the development of the Airsift platform. Lau Thiam Kok and Tassos Noulas contributed to the development of the data architecture that informed the Airsift platform. Sarah Garcin developed the graphic design of the AirKit Logbook webpage and PDF.
The Citizen Sense Dustbox 2.0 included collaborative contributions to the materials design and 3D printing by Andrea Rinaldi, who built on an earlier Citizen Sense Dustbox 1.0 designs developed in collaboration with Francesca Perona and Helen Pritchard.
Special thanks are due to the participants and residents in the Forest Hill area of London who contributed to the development and testing of the Dustbox monitoring kit, as well as to the collection and analysis of data and communication of results to wider publics and regulators. For more information on project contributors, see Citizen Sense People.
This data story is generated using the Citizen Sense Airsift data analysis platform, which was developed to allow for citizen-led interpretation of datasets. The core data available for interpretation is the Dustbox 2.0 PM2.5 sensor data. The Airsift toolkit also brings in air quality data from select sites in the London Air Quality Network (LAQN) and through other sensor APIs for comparison with the citizen data. Please note the Terms of Use for Citizen Sense data.
At the start of the monitoring period, the Dustboxes were co-located with a TSI AM 520 at the University of Cambridge. The site for the co-location study was strategically chosen so that the devices could be evaluated under varying environmental conditions with variable pollution levels. For hourly averaged PM2.5 concentration, the average Pearson correlation (R) was 0.98. Because the Dustboxes demonstrated a high degree of accuracy during the co-location, no scaling factor has been applied to calibrate the devices. Because the sensors were co-located and calibrated during a time of low to moderate pollution, the scaling factor could slightly amplify higher readings in relation to the LAQN readings. However, this would require further testing to demonstrate, since when comparing Dustbox levels with nearby LAQN levels (where available), readings are often comparable. For more information, see "Dustbox 2.0 Calibration and Field Studies." Note that Dustboxes 0001 and 0006 discussed in this study are an earlier version of the diesel char housing that used a different air intake design. For this Dustbox version, a correction factor has been calculated based on an indoor co-location of the diesel char and pollen Dustboxes. A more current version of the diesel char is available on the Citizen Sense Github page.
This data story is prepared under the assumption that all pollutant, cartographic and meteorological measurements are valid and not sufficiently biased to cause misrepresentation of results. Please refer to the Citizen Sense Terms of Use for further information.
The research leading to these results has received funding from the European Research Council under the European Union’s Seventh Framework Programme (FP/2007-2013), ERC Grant Agreement n. 313347, “Citizen Sensing and Environmental Practice: Assessing Participatory Engagements with Environments through Sensor Technologies,” and from the European Research Council under the European Union’s Horizon 2020 research and innovation programme, ERC Grant Agreement n. 779921, “AirKit: Citizen Sense Air Monitoring Kit.”
AirKit is available to use under a CC BY-NC-SA 4.0 license. You are free to use, adapt, and share this toolkit for non-commercial purposes under the same CC BY-NC-SA license, and with attribution to Citizen Sense.
To cite this data story, please use the reference: Citizen Sense, “Indoor vs Outdoor Air Pollution: Forest Hill,” Airkit Data Stories, 1 February 2021. Available at: https://airsift.citizensense.net/indoor-vs-outdoor-pm-levels/.